hankyoreh
Links to other country sites 다른 나라 사이트 링크
Top ten chaebol now almost 80% of Korean economy
By Kwon Eun-jung, staff reporter
The sales of Korea’s ten largest companies are equal to about 80% of Korea’s GDP, according to data posted by the website chaebul.com on August 27. This concentration is believed to be attributable to growth among chaebol and their encroachment on areas that traditionally belonged to small, neighborhood businesses.
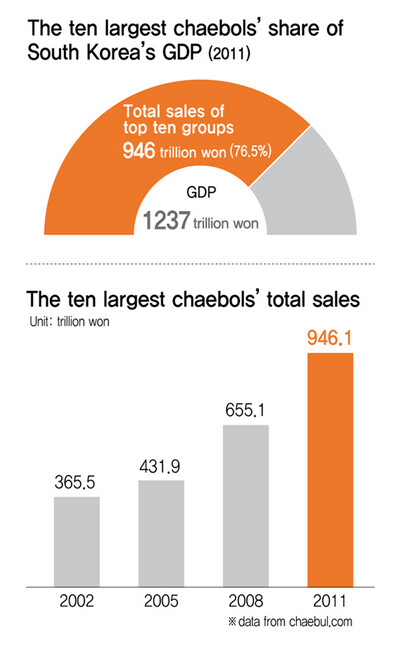
Last year’s total sales for Korea’s ten biggest companies, including Samsung and Hyundai Motor, was 946.1 trillion won (US$83.1 billion). This accounted for 76.5% of Korea’s GDP of nearly 1.24 quadrillion won (US$1.1 trillion).
While Korea’s GDP was 1.8 times larger in 2011 than it was in 2002, having grown from 684.3 trillion won to 1.24 quadrillion won, the sales of the ten biggest companies were 2.6 times larger, growing from 365.5 trillion won to 946.1 trillion won over the same period.
As a percentage of GDP, the sales of the top ten companies grew from 53.4% in 2002 to 63.8% in 2008 and to nearly 80% last year. This year, it appears sales by the ten biggest companies will break the quadrillion won line for the first time ever.
Assets growth has been even steeper. Last year, the top ten companies had 963.4 trillion won in total assets, 3.3 times 2002’s total of 294.2 trillion won.
This was about double the GDP’s growth rate. It’s also a far cry from the situation at the bottom of the economy, which is producing a stream of unemployed youth and self-employed small business owners.
The growth in the top ten companies’ assets appears to be thanks to the companies’ octopus-tentacle expansion style. The top ten companies had 592 subsidiaries in 2011, nearly double 2002’s number of 318.
In the same period, they went from working in 39 business areas to 57. These included traditionally local businesses like Korean sausage makers, bakeries, restaurants and cram schools. The intrusion of big companies into these sectors has led to social criticism.
The internal possession rate of the top ten companies climbed 7.6 points, from 45.9% in 2002 to 53.5% last year. The internal possession rate refers to the ratio of shares of the group’s total capital owned by figures within the company, including the company head who practically controls the group, his relatives, executives and subsidiary companies. The higher this figure, the stronger the company head’s grip on management.
On the other hand, shares owned by the heads of the top ten groups themselves dipped from 1.4% in 2002 to 1.1% in 2011. This reflects how company heads are controlling their groups through a dense cycle of investment between subsidiaries in return for reducing their personal shares.
The top ten companies’ rate of intragroup transactions - deals between a group’s own subsidiaries - has also grown. Last year, the Samsung Group’s rate of intragroup transactions was 52.9%, Hyundai Motor Group’s was 44.0% and SK Group’s was 38.3%. Lotte Fresh Delica, a foodstuffs firm of the Lotte Group, posted a intragroup transactions rate of 95.1%. The Hanjin Group’s Uniconverse’s intragroup transactions rate was 84.7% and SK C&C’s was 65.1%.
It was also commonplace for group subsidiaries to funnel work to the family companies of major shareholders. A Korea Fair Trade Commission investigation in July revealed that most of these intragroup transactions take place through internal designations rather than competitive bids.
Please direct questions or comments to [english@hani.co.kr]

Editorial・opinion
![[Column] Season 2 of special prosecutor probe may be coming to Korea soon](https://flexible.img.hani.co.kr/flexible/normal/500/300/imgdb/original/2024/0426/3317141030699447.jpg "[Column] Season 2 of special prosecutor probe may be coming to Korea soon") [Column] Season 2 of special prosecutor probe may be coming to Korea soon
[Column] Season 2 of special prosecutor probe may be coming to Korea soon![[Column] Park Geun-hye déjà vu in Yoon Suk-yeol](https://flexible.img.hani.co.kr/flexible/normal/500/300/imgdb/original/2024/0424/651713945113788.jpg "[Column] Park Geun-hye déjà vu in Yoon Suk-yeol") [Column] Park Geun-hye déjà vu in Yoon Suk-yeol
[Column] Park Geun-hye déjà vu in Yoon Suk-yeol- [Editorial] New weight of N. Korea’s nuclear threats makes dialogue all the more urgent
- [Guest essay] The real reason Korea’s new right wants to dub Rhee a founding father
- [Column] ‘Choson’: Is it time we start referring to N. Korea in its own terms?
- [Editorial] Japan’s rewriting of history with Korea has gone too far
- [Column] The president’s questionable capacity for dialogue
- [Column] Are chaebol firms just pizza pies for families to divvy up as they please?
- [Column] Has Korea, too, crossed the Rubicon on China?
- [Correspondent’s column] In Japan’s alliance with US, echoes of its past alliances with UK
Most viewed articles
- 1‘We must say no’: Seoul defense chief on Korean, USFK involvement in hypothetical Taiwan crisis
- 2After election rout, Yoon’s left with 3 choices for dealing with the opposition
- 3Why Kim Jong-un is scrapping the term ‘Day of the Sun’ and toning down fanfare for predecessors
- 4AI is catching up with humans at a ‘shocking’ rate
- 5Two factors that’ll decide if Korea’s economy keeps on its upward trend
- 6[Column] Park Geun-hye déjà vu in Yoon Suk-yeol
- 7Division commander ordered troops to enter raging flood waters before Marine died, survivor says
- 8Gangnam murderer says he killed “because women have always ignored me”
- 9South Korea officially an aged society just 17 years after becoming aging society
- 10No good, very bad game for Korea puts it out of Olympics for first time since 1988